In the mid-1990s, Cisco introduced the NetFlow feature on its routers. This NetFlow feature provides the ability to collect information on incoming and outgoing packets from a network interfaces. In general, the NetFlow setup consists of these three main components:
- Flow Exporter: Responsible for collecting network packets and sending them to the Flow Collector.
- Flow Collector: Responsible for receiving and preprocessing data sent from the Flow Exporter.
- Analysis Application: An application that is responsible for analyzing data received from the Flow Collector and usually visualizes it in the form of graphs.
This NetFlow feature was then implemented by many companies that produce routers and switches with different names. For example, Juniper Networks uses the term J-Flow, while MikroTik uses the name Traffic Flow.
I’m currently running a MikroTik RB450G router for my home network, which is why I’m excited to share my experience with using the Traffic Flow feature on one.
Prerequisites
Before starting, you need to install and ensure that Filebeat, ElasticSearch, and Kibana are running properly. Please follow the installation and configuration process from the related documentation pages:
As additional information related to this article, I installed Filebeat on a Linux machine that is still connected to the same network as my MikroTik router. For ElasticSearch and Kibana, I set them up on a Virtual Private Server (VPS).
Access Rights for Filebeat
I created a new user with special access rights that will be used by Filebeat to send processed data from the router to ElasticSearch. To do this, you need to:
- Go to the “Management” > “Security” > “Roles” page in the Kibana Dashboard.
- Create a new role and give it a name for the role. In this article, I named
it
filebeat_setup.
In the “Cluster privileges” section, I granted access to the following:
monitormanage_ilmmanage_index_templatesmanage_collectormanage_ingest_pipelinesmanage_logstash_pipelinesmanage_mlmanage_pipeline
And, in the “Index privileges” section, I granted all privileges for all indices.
To complete the setup, follow these additional steps:
- Go to the “Management” > “Security” page.
- Create a new user and name it
custom_filebeat. - In the “Privileges” section, assign the
filebeat_setuprole that we created earlier. - Additionally, assign the following roles:
kibana_adminingest_admineditormonitoring_userkibana_system
Filebeat NetFlow Module
Login to the Linux machine that has Filebeat installed and adjust the
configuration in /etc/filebeat/filebeat.yml, especially in the setup.kibana
and output.elasticsearch sections. My current filebeat.yml configuration is
as follows:
1setup.kibana:
2    host: "https://kibana.ditatompel.com:443"
3
4output.elasticsearch:
5    hosts: ["https://elastic-ap-southeast1-ctb1.ditatompel.com:443"]
6    username: "custom_filebeat"
7    password: "MySuperSecretPasswordThatMayAppearsOnYourFreakinAICompletions"
8    ssl:
9        enabled: true
Then edit /etc/filebeat/modules.d/netflow.yml.disabled and change
netflow_host to 0.0.0.0 so that Filebeat can receive data from the MikroTik
router. My current netflow module configuration is as follows:
1- module: netflow
2  log:
3      enabled: true
4      var:
5          netflow_host: 0.0.0.0
6          netflow_port: 2055
7          internal_networks:
8              - private
After that, enable the netflow module by running sudo filebeat modules enable netflow command. To see the available modules, both active and
inactive, use the command sudo filebeat modules list.
Then run the command sudo filebeat setup -e to set up the index template
and dashboards on Kibana.
Finally, restart the Filebeat service by running the command sudo systemctl restart filebeat.
MikroTik Traffic Flow Configuration
Login to the MikroTik router, using either SSH or Winbox. In this article, I use Winbox for easier configuration management.
Go to “IP” > “Traffic Flow”. Click on the “Targets” menu and add a new target. Change the “Dst. Address” field to the IP address of your Filebeat server. Set the “Version” to “IPFIX” and ensure the “Enabled” checkbox is selected. Then, click the “Ok” button.
In the “Traffic Flow Settings” menu, select the interfaces you want to process and verify that the “Enabled” checkbox remains checked.
Kibana Dashboard
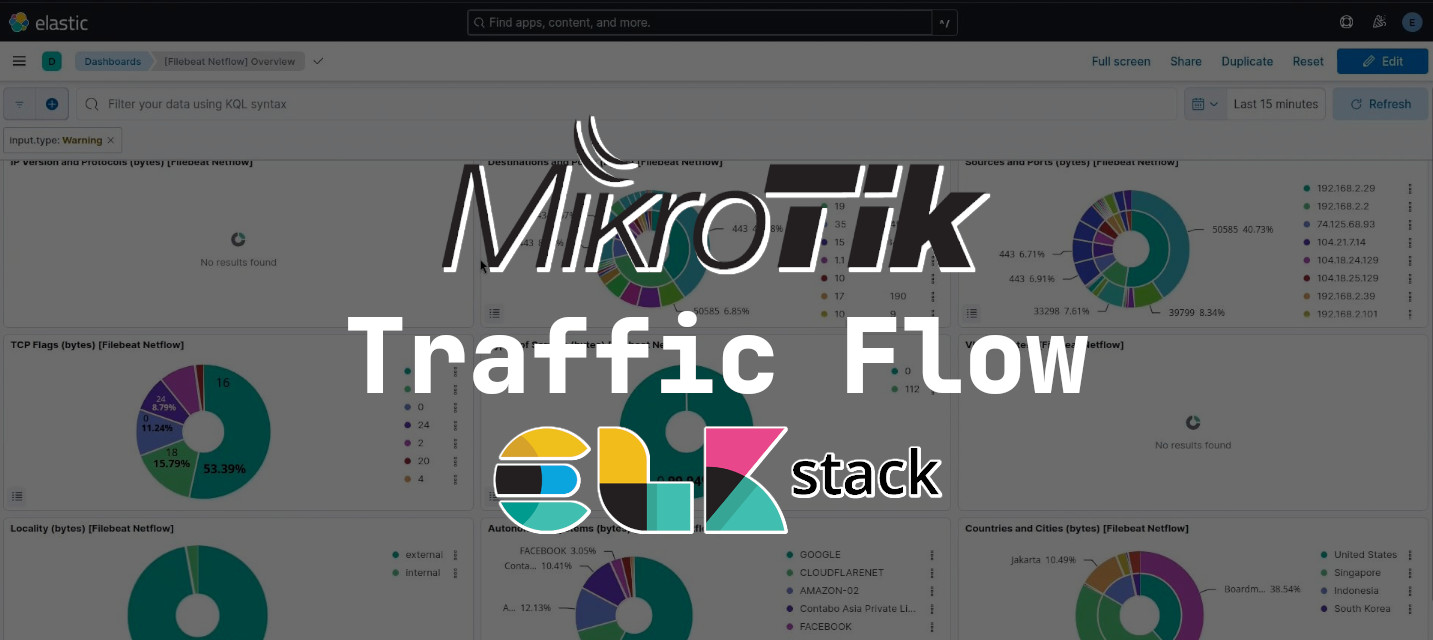
For processed NetFlow results, go to “Analytics” > “Dashboards”. You will see a variety of automatically generated dashboards by Filebeat. Search for keywords like “netflow” and explore the dashboards.
